Introduction
The BRIX refractometer has become a widely used tool on dairy farms to estimate the IgG concentration of colostrum and determine whether or not the colostrum is suitable (i.e., sufficient IgG) to feed to newborn calves in the first day of life. We tell producers that colostrum with more than 21% or 22% BRIX generally contains more IgG than colostrum with lower BRIX values. While this management approach is being widely and successfully used in many parts of the world, a recent paper from the Journal of Animal Science challenges the accuracy of the BRIX refractometer to estimate colostrum IgG. Based on this research, some professionals are advising producers “Why there is no such thing as colostrum quality” and that using the BRIX refractometer is a waste of time.
The Controversy
Recently, Schalich et al. (2021) challenged the value of using a BRIX refractometer on farms to estimate colostrum IgG. These authors collected colostrum from cows and evaluated the relationship between BRIX and IgG, measured using Western Blotting, a technique not typically used for measuring IgG in colostrum. The researchers compared the relationship between BRIX and IgG and found no significant relationship. So, they concluded that “Based on our results, the current classification of “good” and “poor”-quality colostrum as interpreted by ˚Bx values is unfounded; IgG concentration is not reflected in ˚Bx values, and any extrapolation for on-farm management is unsubstantiated.”. Wow! Strong words, particularly when considering that many other studies show a strong relationship between BRIX and colostrum IgG.
A group of researchers expressed concern about the paper by Schalich et al. (2021). Their concern was that published studies that question the use of BRIX to measure colostrum IgG might spread confusion in the industry and farmers may not use the BRIX refractometer to manage colostrum feeding. So, they wrote a letter to the editor (Lombard et al., 2022) and concluded that the BRIX refractometer was indeed a valuable on-farm tool. These authors (including myself) wrote: “The conclusion that the “classification of good- and poor-quality colostrum as interpreted by °Bx values is unfounded …” with a sample size of 27 high quality colostrum samples is not valid, generates confusion, and its adoption could be detrimental for dairy-calf health. We believe previous literature shows the utility of the Brix refractometer in identifying poor quality colostrum and urge producers to keep using this management tool until a better tool becomes available or we have clear evidence that Brix refractometer values are not helpful in identifying poor quality colostrum.”
Not to be deterred, the original researchers responded to the challenge by Lombard et al. (2022). Their response to the letter (Schalich and Selvaraj, 2022) “doubled down” on their conclusion that colostral IgG and BRIX were not meaningfully related. The authors wrote “Our conclusion that “˚Bx values do not reasonably indicate IgG concentration to serve as a measure of ‘colostrum quality’” (Schalich et al. 2021), is based on irrefutable experimental evidence. Through detailing the component-by-component basis of Brix® {sic}refractometer readings (˚Bx), we revealed the impact of an independent variable, that effectively invalidated strong conclusions drawn in prior studies regarding the prediction of IgG concentration from ˚Bx values of colostrum.”
So, what gives? Who’s correct in this debate of the value of the BRIX refractometer? Let’s take a deeper dive into the science behind the debate and see if we can understand what’s going on. But, to begin, and to help us understand the nature of this debate, I’ll use an analogy of one of my favorite pastimes – marathon running.
An analogy
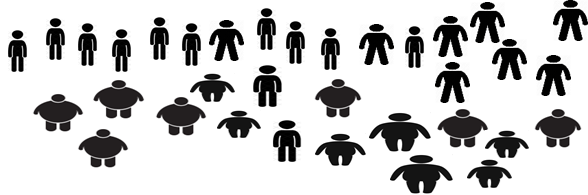
Let’s say that we want to know what physical factors are associated with a runner’s finishing time in the marathon. We notice that, while people with different body types (fat, thin, muscular, average, Figure 1) will finish a marathon, most of the fastest finishers tend to be on the thinner part of our body mass spectrum. We see that in a typical marathon, 9 of the top 10 finishers are thin runners (Figure 2) and there’s not so much variation here. If we look at finishers in the later parts of the marathon (Figure 3), we see more larger runners and more variation in those finishers.
So, we want to see if body fatness is related to the runner’s finishing time. Times to finish the marathon might range from a little more than 2 hours to about 8 hours, depending on the runner’s degree of training, experience, muscle strength, endurance – and maybe body fat.

We want to know if there’s a relationship between body fat and finishing times for all marathoners, so we find a representative subset of finishers – with finishing times from less than 3 hours to more than 6 hours – and we see a representation of the body types in Figure 4.

Note that in Figure 4 we want to true representation of all finishers – not just the fastest or slowest. And, we want a large enough number of finishers to capture the total variability in body types – we may have some fat runners who are really fast, and some thin runners who are pretty slow. We choose a large enough “sample size” to capture all of this variation. We also want our sample to represent as many runners as possible – so we measure fast runners, slow runners, and those in the middle. There are statistical “rules” that tell us how many subjects we need to use, so we follow these “rules” and end up measuring 250 volunteers at the end of the race. Stinky work, but done in the name of science!

For each runner, we record their marathon finishing time and their body fat percentage, using a handy device called a skin-fold caliper. You simply squeeze a person’s waist and the caliper will estimate the person’s total body fat percentage. It’s fast, easy, and cheap to estimate body fat percentage using skin-fold calipers.
So, we measure all the runners in our sample, put the data into the computer, do some “statistical magic” and… voila! We see that there is indeed a relationship between body fat and finishing time (Figure 5)! We see that, in general, thinner runners are more likely to finish earlier and fatter runners are likely to finish later. The R2 statistic tells us how close the relationship is. An R2 = 1.0 is a perfect relationship and R2 = 0 means there’s no relationship. In our example, the R2 = 0.67, which is a pretty reasonable value, and indicates that fatness indeed influences finishing times.
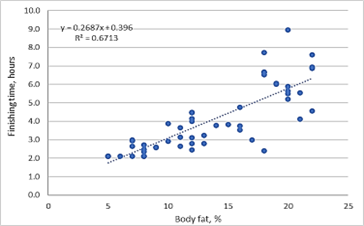
A runner with 10% body fat in our sample is likely to run about 3 hours while a runner with 20% body fat will probably run about 6 hours. Of course, the relationship is not perfect, and we know that other factors will affect finishing time. So, we’re happy that we’ve solved one of the mysteries of the universe – success in the marathon is at least somewhat related to body fatness.
Back to the Controversy
Let’s also say that there’s another research group, who did a similar type of evaluation – determining fat percentage in marathon runners. Unlike our study, these researchers used a different – and more accurate – method to measure body fat percentage. Their method involves injecting dye into a person’s vein and then collecting blood samples over a period of time. Obviously, not a lot of marathon runners are willing to get injected with dye and give blood right after finishing a marathon, so their sample is small – only about 25 volunteers. It also turns out that the group willing to be measured were the fastest runners, like those in Figure 2. They do their analysis and find no relationship between body fat percentage and finishing times. The researchers conclude that their research is correct and our research must be wrong, because we used skin-fold calipers, which aren’t as accurate as their dye method. They don’t mention that their small number of measurements was only in elite runners, who are all thin, and who are all fast. They write up the research proclaiming that the rest of the scientific literature is wrong and they’re right and body fat is NOT related to finishing time.
Back to BRIX
So what does this analogy have to do with the “BRIX controversy”? A lot actually. Here are a few considerations regarding IgG and BRIX.
IgG and BRIX measures in colostrum are highly correlated. I’ve summarized a number of studies that are available in the literature regarding measurement of colostrum IgG and BRIX in several mammalian species (Table 1). The consistency of the relationship between IgG and BRIX is truly impressive. In 30 of the 32 studies, the correlation was highly significant, indicating a strong relationship. In only two studies (Gross et al., 2017 and Schalich et al., 2021) was the correlation not statistically significant. And in these two studies, fewer than 30 samples were used in their respective analyses. Further, samples in these two studies generally measured colostrum with high concentrations of IgG, which may not be representative of the actual population being measured on modern dairy farms.
Schalich et al. (2021) measured a small number of colostrum samples (n = 28) and found that factors other than IgG were related to BRIX. They concluded that other colostral components (e.g., fat, non-Ig proteins) were highly related to BRIX. Their samples were all high in IgG and the range of their IgG concentrations were dissimilar to ranges of IgG found in colostrum sampled in populations that were representative of colostrum collected on modern dairy farms (e.g., Morrill et al., 2011). So, like measuring only the elite athletes, these authors found no relationship between BRIX and IgG.
Refractometers don’t measure IgG. Schalich et al. (2021) argued that BRIX refractometers don’t measure IgG. They concluded that BRIX is more highly correlated to solids. There is no epiphany here. Many other studies in the literature have also reported that BRIX is more highly related to total solids concentration than IgG per se. I summarized this relationship in Calf Note #039.
Let’s be clear – a refractometer doesn’t measure IgG. A refractometer only measures the bending of light as it passes through a liquid. Dissolved particles interact with the light, causing it to bend as it passes through the solution. More particles means more bending of the light. The change is linear, so we can assign values to these changes. In colostrum, ALL the solutes will contribute to the bending of light, which we measure as increases in the BRIX value. Therefore, colostrum with more fat will increase the BRIX value. Proteins other than IgG will increase the BRIX value. More lactose will increase the BRIX value. Thus, the idea that BRIX accurately measures IgG is simply incorrect. Therefore, critics of BRIX refractometers are technically correct that BRIX doesn’t measure IgG. A more accurate conclusion is that BRIX measures total solids in colostrum.
IgG is related to colostral solids. Fortunately, there is a strong relationship between total solids and IgG in colostrum, as has been reported by many authors (e.g., Quigley et al., 1994; Hue et al., 2021). In general, colostrum with greater density (more total solids) has more IgG. This is the reason that there is a relationship between BRIX and IgG in colostrum. BRIX estimates solids and solids is related to IgG – as well as other components of colostrum. However, if we look at the totality of colostrum likely to be produced on a farm, there is good relationship between BRIX and IgG.
BRIX can reasonably exclude low IgG colostrum. In my marathon example, I mentioned that I might find thin runners who are slow, but I’m not likely to find may fat runners who are fast. The same situation holds true for colostrum. With high BRIX colostrum, the high solids concentration could be due to large amounts of fat, casein, or non-IgG whey proteins. It could also be due to high concentrations of IgG. And, we know that, because solids and IgG are related, there is a reasonable likelihood that high BRIX colostrum is likely to have higher IgG.
However, what about low BRIX colostrum? In this case, the probability of low BRIX colostrum having lots of IgG is quite remote – like my analogy of fat runners completing a marathon in less than three hours. So, in this case, the BRIX refractometer can be a reasonable tool to exclude colostrum that is unlikely to have enough IgG to feed the calf while it can most efficiently absorb IgG. This simple management change can effectively reduce the percentage of failure of passive immunity on the farm and reduce morbidity and mortality.
BRIX is a reasonable on-farm estimate of IgG. A BRIX refractometer is simple, cheap, and fast. It can give us a reasonable idea of the total solids content, and in most cases, the IgG concentration of colostrum. It’s certainly not perfect! The correlation coefficients listed in the Table indicate the strength of the relationship between BRIX and IgG. If we square the correlation coefficient, we calculate the statistic R2, which tells us the proportion of variability accounted for by the two variables. Of course, other factors may affect BRIX measures, but the degree of relationship between IgG and total solids suggests that we can reasonably exclude the colostrum <20% BRIX that is much less likely to contain sufficient IgG.
BRIX and IgG may not be related in one study. The strength of the relationship between colostral BRIX and IgG depends on sufficient variability within the dataset being tested. A small data set with limited variability is much less likely to show a statistical relationship between BRIX and IgG, as reported by Schalich et al. (2021). Therefore, it’s important to look at several studies with different populations of animals and under different conditions to conclude if there truly is a relationship between BRIX and IgG. Table 1 shows the high degree of relationship between BRIX and IgG in cows and other species. So, while one author may report a lack a relationship, when we consider “the bigger picture”, we conclude that the relationship certainly exists.
Conclusions should be based on representative sampling. To be applicable to the industry, the sample of data (in this case, of colostrum) used a study should be representative of the population for which we want to make conclusions. In many cases, a small sample limits the wide application of results. Sample sizes may be small, or the variation within the study population may be too small to truly represent the entire population of animals we see in the industry. In the case of small samples, it’s common for study authors to conclude something like “within the context of our study” to warn the reader that other studies should be considered before a conclusion can be reached regarding the entire population of cows in the industry.
Summary
The BRIX refractometer is an excellent tool to manage the colostrum we feed to calves. It can be used to exclude colostrum that is likely to contain too little solids – and IgG – to be used as a first feeding for calves. Calf raisers should continue to use this tool in their colostrum management programs. Those who advise producers to ignore the BRIX refractometer are doing a disservice to the industry and to the farmers they advise.
Table 1. Published references comparing BRIX and IgG in colostrum from various mammalian species.
| Reference | Species | Breed | IgG method | No. samples | IgG Range (low-high) | Correl. | Prob. |
| Molla, 1980 | Dairy Cattle | RID | 0.89 | 0.001 | |||
| Chigerwe, 2008 | Dairy Cattle | Holstein | RID | 171 | 0.64 | 0.001 | |
| Bielmann, 2010 | Dairy cattle | Holstein | RID | 288 | 22.4 – 196.9 | 0.71* | 0.001 |
| Morrill, 2012 | Dairy cattle | Varied | RID | 824 | 2 – 116 | 0.73† | 0.001 |
| Quigley, 2013 | Dairy cattle | Holstein | RID | 183 | 7.1 – 159.0 | 0.75 | 0.001 |
| Bartier, 2015 | Dairy cattle | RID | 569 | 8.3 – 128.6 | 0.64 | 0.001 | |
| Morrill, 2015 | Dairy cattle | Jersey | RID | 58 | 12.8 – 154.3 | 0.79 | 0.001 |
| Dunn, 2017 | Dairy, Beef cattle | Varied | ELISA RID | 20 20 | 25 – 70** 48 – 120** | 0.76 0.60 | 0.001 0.005 |
| Elsohaby, 2017 | Dairy cattle | Holstein | RID | 240 | 8.4 – 232.4 | 0.72 | 0.001 |
| Gross, 2017 | Dairy cattle | Holstein | ELISA | 28 | 40 – 395** | 0.18 | NS |
| Stojić, 2017 | Dairy cattle | Holstein | RID | 16 | 65 – 165 | 0.77 | 0.001 |
| Silva-del-Río, 2017 | Dairy cattle | Jersey | RID | 134 | 23.7 – 172.9 | 0.81 | 0.001 |
| Pechova, 2019 | Dairy cattle | Varied | RID | 1,522 | 5.2 – 199.1 | 0.67 | 0.001 |
| Lemberskiy-Kuzin, 2019 | Dairy cattle | Holstein | ELISA | 72 | 8 – 113 | 0.79 | 0.001 |
| Johnsen, 2019 | Dairy cattle | Norw. Red | RID | 167 | 5 – 129 | 0.71 | 0.001 |
| Gamsjäger, 2020 | Beef cattle | Varied | RID | 416 | 19.2 – 264.7 | 0.71 | 0.001 |
| Fahim, 2021 | Dairy cattle | Montbeliard | ELISA | 132 | 6.0 – 114.8 | 0.68 | 0.001 |
| Kessler, 2021 | Dairy cattle | ELISA | 108 | 0.83 | 0.001 | ||
| Schalich, 2021 | Dairy cattle | Holstein | Western blot | 27 | 80 – 245** | 0.36 | NS |
| Sockett, 2022¤ | Dairy cattle | RID | 183 | 17 – 222 | 0.85 | 0.001 | |
| Vermeire, 2022¤ | Dairy cattle | Holstein | fTIR‡ | 441 | 1.2 – 63.8 | 0.70 | 0.001 |
| Mila, 2015 | Dogs | ELISA | 145 | 0.8 – 61.4 | 0.53 | 0.001 | |
| Giammarco, 2021 | Buffalo | ELISA | 26 | 13 – 110 | 0.75 | 0.001 | |
| Harker, 1978 | Sheep | RID | 0.79 | 0.001 | |||
| Sjoberg, 2021¤ | Sheep | RID | 40 | 0.6 – 297.6 | 0.82 | 0.001 | |
| Kessler, 2021 | Sheep | ELISA | 100 | 6.2 – 65.4 | 0.75 | 0.001 | |
| Castro, 2018 | Goats | Majorera | ELISA | 216 | 0.1 – 54.0 | 0.89 | 0.001 |
| Buranakarl, 2021 | Goats | Varied | ELISA | 21 | 6.7 – 16.2 | 0.59 | 0.005 |
| Kessler, 2021 | Goats | ELISA | 116 | 4.8 – 75.0 | 0.83 | 0.001 | |
| Hasan, 2016 | Swine | Yorkshire x Landrace | ELISA | 153 | 12.8 – 130.3 | 0.64 | 0.001 |
| Balzani, 2015 | Swine | RID | 42 | 13.3 – 35.0 | 0.56 | 0.001 | |
| Cash | Equine | RID | 66 | 0 – 80 | 0.94 | 0.001 |
*Correlation coefficient for optical refractometer. Digital refractometer correlation = 0.73.
**Estimated from graphical data.
†Correlation of samples wherein BRIX was measured immediately and RID was measured in samples frozen once = 0.90 (n = 196).
‡fTIR = Fourier-transform infrared spectroscopy.¤Non-refereed abstract.
References
Balzani, A., H. J. Cordell, and S. A. Edwards. 2015. Evaluation of an on-farm method to assess colostrum IgG content in sows. Animal. http://dx.doi.org/10.1017/S1751731115002451.
Bartier, A. L. , M. C. Windeyer, and L. Doepel. 2015. Evaluation of on-farm tools for colostrum quality measurement. J. Dairy Sci. 98:1878–1884. https://doi.org/10.3168/jds.2014-8415.
Bielmann, V. , J. Gillan, N. R. Perkins, A. L. Skidmore, S. Godden, and K. E. Leslie. 2010. An evaluation of Brix refractometry instruments for measurement of colostrum quality in dairy cattle. J. Dairy Sci. 93:3713–3721. https://doi:10.3168/jds.2009-2943.
Buranakarl, C., S. Thammacharoen, M. Nuntapaitoon, S. Semsirmboon, and K. Katoh. 2021. Validation of Brix refractometer to estimate immunoglobulin G concentration in goat colostrum. Veterinary World. Available at www.veterinaryworld.org/Vol.14/December-2021/18.pdf.
Cash, R.S.G. 2010. Colostral quality determined by refractometry. Equine Vet. Educ. 11:36-38. https://doi.org/10.1111/j.2042-3292.1999.tb00916.x.
Castro, N., L. A. Gómez-González, B. Earley, and A. Argüello. 2018. Use of clinic refractometer at farm as a tool to estimate the IgG content in goat colostrum. J. Appl. Anim. Res. https://doi.org/10.1080/09712119.2018.1546585.
Chigerwe, M., J. W. Tyler, J. R. Middleton, J. N. Spain, J. S. Dill, and B. J. Steevens. 2008. Comparison of four methods to assess colostral IgG concentration in dairy cows. JAVMA. 233:761-765. https://doi.org/10.2460/javma.233.5.761.
Elsohaby, I., J. T. McClure, M. Cameron, L. C. Heider, and G. P. Keefe. 2017. Rapid assessment of bovine colostrum quality: How reliable are transmission infrared spectroscopy and digital and optical refractometers? J. Dairy Sci. 100:1427–1435. https://doi.org/10.3168/jds.2016-11824.
Fahim, N. H., and T. A. Imbabi. 2021. Comparison between the Brix Refractometer and ELISA for Assessment of colostrum IgG of Montbeliard x Holstein cross dairy cows. Tropical Animal Science Journal. Vol. 44. https://doi.org/10.5398/tasj.2021.44.3.356.
Gamsjäger, L., I. Elsohaby, J. M. Pearson, M. Levy, E. Pajor, D. M. Haines, and M. C. Windeyer. 2020. Assessment of Brix refractometry to estimate immunoglobulin G concentration in beef cow colostrum. J. Vet. Intern. Med. 34:1662–1673. https://doi.org/10.1111/jvim.15805.
Giammarco, M., M. Chincarini, I. Fusaro, A. C. Manetta, A. Contri, A. Gloria, L. Lanzoni, L.M.E. Mammi, N. Ferri, and G. Vignola. 2021. Evaluation of Brix refractometry to estimate immunoglobulin G content in buffalo colostrum and neonatal calf serum. Animals. 11:2616. https://doi.org/10.3390/ani11092616.
Gross, J. J., E. C. Kessler, and R. M. Bruckmaier. 2017. Quarter vs. composite colostrum composition assessed by Brix refractometry, specific gravity and visual color appearance in primiparous and multiparous dairy cows. Transl. Anim. Sci. 1:26–35. https://doi:10.2527/tas2016.0001.
Harker, D. B. 1978. A simple estimation of the immunoglobulin content of ewe Colostrum. Vet. Rec. 103:8-9.
Hasan, S. M. K., S. Junnikkala, A. Valros, O. Peltoniemi, and C. Oliviero. 2016, Validation of Brix refractometer to estimate colostrum immunoglobulin G content and composition in the sow. Animal. 10:1728–1733. https://doi:10.1017/S1751731116000896.
Hue, D. T., J. L. Williams, K. Petrovski, and C.D.K. Bottema. 2021. Predicting colostrum and calf blood components based on refractometry. J. Dairy Res. 88:194-200. https://doi.org/10.1017/S0022029921000340.
Johnsen, J. F., J. Sørby, C. M. Mejdell, Å. M. Sogstad, A. Nødtvedt, and I. H. Holmøy. 2019. Indirect quantification of IgG using a digital refractometer, and factors associated with colostrum quality in Norwegian Red Cattle. Acta Vet Scand. 61:59. https://doi.org/10.1186/s13028-019-0494-9.
Kessler, E. C., R. M. Bruckmaier, and J. J. Gross. 2021. Short communication: Comparative estimation of colostrum quality by Brix refractometry in bovine, caprine, and ovine colostrum. J. Dairy Sci.104:2438-2444. https://doi:10.3168/jds.2020-19020.
Lemberskiy-Kuzin, L., S. Lavie, G. Katz, U. Merin, and G. Leitner. 2019. Determination of immunoglobulin levels in colostrum by using an online milk analyzer. Canadian J. Anim. Sci. https://doi.org/10.1139/cjas-2018-0178.
Lombard, J., J. Quigley, D. Haines, F. Garry, T. Earleywine, N. Urie, M. Chamorro, S. Godden, S. McGuirk, G. Smith, C. Shivley, D. Catherman, A. J. Heinrichs, R. James, J. Maas, K. Sterner, and D. Sockett. 2022. Letter to the editor: Comments on Schalich et al. (2021), Colostrum testing with Brix is a valuable on-farm tool. https://doi.org/10.193/jas/skab083.
Molla, A. 1980. Estimation of bovine colostral immunoglobulins by refractometry. Vet. Rec. 107:35-36. https://doi:10.1136/vr.107.2.35.
Morrill, K. M., E. Conrad, J. Polo, A. Lago, J. Campbell, J. Quigley, and H. Tyler. 2012. Estimate of colostral immunoglobulin G concentration using refractometry without or with caprylic acid fractionation. J. Dairy Sci. 95:3987–3996. http://dx.doi.org/10.3168/jds.2011-5104.
Morrill, K. M., K. E. Robertson, M. M. Spring, A. L. Robinson, and H. D. Tyler. 2015. Validating a refractometer to evaluate immunoglobulin G concentration in Jersey colostrum and the effect of multiple freeze–thaw cycles on evaluating colostrum quality. J. Dairy Sci. 98:595–601.
http://dx.doi.org/10.3168/jds.2014-8730.
Quigley, J. D., A. Lago, C. Chapman, P. Erickson, and J. Polo. Evaluation of the Brix refractometer to estimate immunoglobulin G concentration in bovine colostrum. 2013. J. Dairy Sci. 96 :1148–1155 https://doi.org/10.3168/jds.2012-5823.
Quigley, J. D., K. R. Martin, H. H. Dowlen, L. B. Wallis, and K. Lamar. 1994. Immunoglobulin concentration, specific gravity, and nitrogen fractions of colostrum from Jersey cattle. J. Dairy Sci. 77:264-269. https://doi.org/10.3168/jds.S0022-0302(94)76950-2.
Pechova, A., S. Slosarkova, S. Stanek, E. Nejedla, and P. Fleischer. 2019. Evaluation of colostrum quality in the Czech Republic using radial immunodiffusion and different types of refractometers. Veterinarni Medicina, 64:51–59. https://doi.org/10.17221/122/2018-VETMED.
Schalich, K. M., O. M. Reiff, B. T. Nguyen, C. L. Lamb, C. R. Mondoza, and V. Selvaraj. 2021. Temporal kinetics of bovine mammary IgG secretion into colostrum and transition milk. J. Anim. Sci. 99:skab083. https://doi:10.1093/jas/skab083.
Schalich, K. M., and Vimal Selvaraj. 2022. Contradictions on colostrum IgG levels and Brix values are real and can be explained. Response to letter by Lombard et al. (2022). J. Anim. Sci.100:1–4 https://doi.org/10.1093/jas/skac120.
Silva-del-Río, N., D. Rolle, A. García-Muñoz, S. Rodríguez-Jiménez A. Valldecabres, A. Lago, and P. Pandey. 2017. Colostrum immunoglobulin G concentration of multiparous Jersey cows at first and second milking is associated. J. Dairy Sci. 100:5774-5781. https://doi.org/10.3168/jds.2016-12394.
Sjoberg, A., and R. Van Saun. 2021. Use of brix refractometer in assessing sheep colostrum. AABP Proceedings. 54:273.
Sockett, D. C., L. W. Smith, N. S. Keuler, and T. J. Earleywine. 2022. Strategic management of bovine colostrum. J. Dairy Sci. 105( Suppl. 1): 12 (Abstr.).
Stojić, M., N. Fratić, M. KovačIić, V. Ilić, D. Vozdić, O. Savić, R. Đoković, and O. Valčić. 2017. Brix refractometry of colostrum from primiparous dairy cows and new-born calf blood serum in the evaluation of failure of passive transfer. Acta Veterinaria-Beograd 67:508-524. https://doi:10.1515/acve-2017-0041.
Vermeire, D. A., and D. A. DeKlyen. 2022. BRIX does not accurately estimate immunoglobulin content in colostrum. J. Dairy Sci. 105( Suppl. 1): 324 (Abstr.).
Hi Jim,
This is an excellent response to the so called “controversy” created by
Schalich, et al.
Well done!